5.1 Mangrove RS reviews
5.1.1 Adam, 2010
“Multispectral and hyperspectral remote sensing for identification and mapping of wetland vegetation: A review” (Adam, Mutanga, and Rugege 2010)
Key contribution: This review examines the status quo of mapping wetland vegetation using spectral (multi and hyper) imagery, with a particular focus on discriminating wetland vegetation as well as monitoring biophysical and biochemical characteristics.
Key findings:
The spectral and spatial composition of mangrove species and vegetation assemblages complicates use of multispectral (broadband) imagery
Hyperspectral (narrowband) imagery is promising but more difficult to access
Spectral signatures of different wetland vegetation types are often similar, and are “muddied” by spectral reflectance from soil, hydrologic regime or atmospheric conditions
Spectral signatures affected most strongly by biochemical and biophysical properties of leaves, which vary greatly across species
Discrimination of wetland species from Landsat TM or SPOT imagery has generally been insufficient due to: 1. Lack of fine, ecological divisions between vegetation species 2. Broad nature of spectral wavebands 3. Lack of high spectral and spatial resolution to detect subcanopy vegetation types
Aritifical Neural Networks and fuzzy classification techniques have shown promise in better classifying mixed species pixels
Most important biochemical and biophysical properties characterizing wetland species are: 1. Chlorophyll - green pigment 2. Biomass concentration - biophysical prop 3. Leaf water content
Major issue of using vegetation indices (e.g., NDVI) to estimate biomass is the saturation problem - Mutanga and Skidmore (2004) propose one mechanism to resolve saturation problem
Building spectral libraries via hyperspectral sensors is critical for discriminating wetland species, but also needs investigation at different sites & scales as reflectance within species may vary depending on environmental conditions
- Vaiphasa and Li Wang have done much of the work in building hyperspectral libraries for mangroves (see 5.2.8 & 5.2.10)
Research ideas:
- Spectral imagery can be effective in monitoring plant water content, which may vary significantly across mangrove species due to differing water use efficiencies
5.1.2 Heumann, 2011
“Satellite remote sensing of mangrove forests: Recent advances and future opportunities” (Heumann 2011)
Key contribution: One of several reviews of mangroves and remote sensing techniques that focuses primarily (i.e., solely) on vegetation mapping.
Key findings:
Spectral discrimination of different species not successful using multispectral (broadband) imagery (Ramsey and Jensen, 1996).
- Mixed pixels also an issue for discriminating species as well as estimating canopy structure
Spectral saturation at high biomass values is a particular problem for mapping biomass and volumes
Very high resolution imagery effective at reducing mixed pixels just due to smaller size
OBIA has typically been applied to species discrimination rather than extent of mangrove mappings
Quickbird and IKONOS sensors are most common for very high resolution imagery due to long-term archiving of data
- Multispectral sensors but show improvement over Landsat TM or ETM+ due to reduced numbers of mixed pixels
Use of spectral data only is often insufficient for discrimination of species
- Classification accuracies are greatly improved when other image properties are considered, such as texture
- Texture analaysis has been applied to species discrimination, but has not been investigated (as of 2011) for other forest characteristics
C-band polarimetric SAR has lowest ability to parse forest structure of SAR bands
Mangrove biomass specific findings:
- Canopy height and biomass have been shown to be strongly correlated in mangroves (e.g., Fromard et al., 1998; Smith and Whelan, 2006)
- Most studies of height and biomass have employed SAR data
- Different polarizations (based on wavelength) interact differently with different components of the forest
- Trunks and soils may produce single or double bounce interactions (typically woody components best detected by L-band)
- Signal may scatter within canopy
- P-band polarimetric SAR or HV polarization of L-band SAR perform best in mapping aboveground biomass
Very-high resolution satellites:
- IKONOS and Quickbird are most commonly used, due to archiving of data and plans for long-term consistency
- IKONOS > GeoEye-1 (successor) (multispect @ 1.65 m and panchrom @ 0.41 m)
- Quickbird > Worldview-2 (successor) (<2 m multi, <0.5 m panchrom)
- Note that Worldview-2 has 8 multispectral channels, including those in yellow and red edge ranges designed for vegetation studies
Research ideas:
- Coupling of species maps with species-specific allometric equations for better estimates of mangrove biomass
- Might make sense in Americas where just three species exist (easier!)
5.1.3 Kuenzer, 2011
“Remote sensing of mangrove ecosystems: A review” (Kuenzer et al. 2011)
Key contribution: This is a very extensive review of remote sensing and mangroves. It may not provide much more detail beyond that of the other two reviews of remote sensing and mangroves.
Notes:
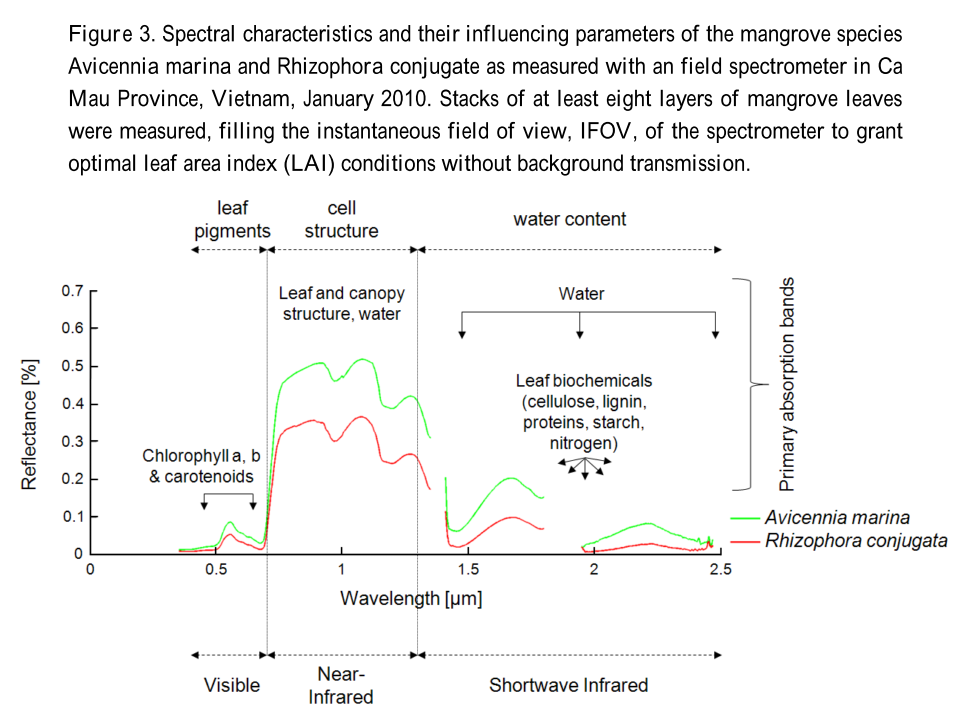
Optical imagery:
The spectral signature of mangrove leaves are largely a function of age, vitality, phenological properties and physiological properties. Greater discrimination between species (at least in Vietnam) may be seen in the NIR, but little differentiation seen across the visible light wavelengths:
Radar imagery:
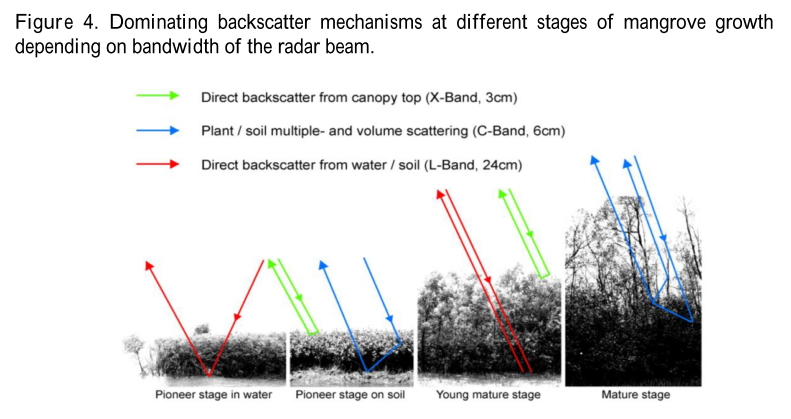
- SAR imagery provides intensity values of the “backscatter coefficient”. Given different polarizations and wavelengths of SAR scanning, different interactions with mangrove landscape occur.
- The different SAR bands are as follows:
- X-band - 3 cm wavelength, effective for direct backscatter from canopy
- C-band - 6 cm, plant/soil multiple and volume scattering
- L-band - 24 cm, direct backscatter from soil & water
- P-band - 68 cm, longest wavelength
Sensors:
See Table 2 in the study for an extensive list of sensors used within remote sensing of mangrove studies
Aerial imagery is limited in that it cannot be scaled beyond immediate site/locality, but has value in that it can provide high-resolution data particularly for hard to access sites without field data.
High spatial resolution data (IKONOS & Quickbird):
- Ultimate goal is to map mangroves at the species level
- A comparison of IKONOS and QuickBird found IKONOS (4 m) to be more effective at discriminating in species because of the higher spectral resolution. QuickBird has higher spatial resolution (1 m) but was less useful in this particular investigation (Greg’s paper).
Hyperspectral imagery - Identifying relevant bands is a time intensive process and many bands are highly correlated
EnMAP sensor - Satellite hyperspectral data that will provide more access to hyperspectral datasets globally - Is this online? I’m not sure yet.
Several tables are given in the paper that describe the various data sensors and platforms and their relative benefits and limitations for remote sensing of mangroves.
Needs within RS of mangroves space:
The authors call for several needs within the remote sensing of mangrove space:
- Need for homogenized classification schemes
- “Ontologies”, e.g., what is a sparse versus dense mangrove
- Need for standardized data-processing models
- Standardiziing preprocessing, processing and post processing such that enhanced comparability of studies is enabled
- Need for homogenized transparent accuracy assessment
- Need for further investigations of synergistic data use
- Coupling of new, novel and disparate RS datasets to investigate novel research questions
- Need for ecosystem service assessments
- Need for interdisciplinary and well-networked research teams
5.1.4 Giri, 2016
“Observation and monitoring of mangrove forests using remote sensing: Opportunities and challenges” (Giri 2016)
Key contribution: This is an introductory piece to a special issue on monitoring mangroves using RS. There are potentially interesting pieces in the special issue but most are focused on vegetation dynamics rather than geomorphology.
Giri is one of the key researchers working on mapping of mangrove forests using RS data, and offers some succinct advice on steps for classifying mangrove forests:
- Identify clear and concise objective
- Develop classification system and legend
- Satellite and secondary data acquisition
- Data pre-processing
- Training data collection
- Image classification
- Results validation
- Dissemination of results
- Application of classification results
Random notes:
- Important to be clear on consideration of purely true mangroves, or true mangroves with mangrove associates.
- Entire Landsat archive available in Amazon Web Services as well as Google Earth Engine.
Article synopses:
- Zhu et al, 2016:
- Looked at back-propagation artificial neural network to map mangrove forest biomass using WorldView-2 imagery.
- Find that inclusion of species dummy variable for S. apetala vs K. candel highly significant in improving biomass estimation accuracy
- Cuogo et al, 2016:
- Examined SAR backscattering from Radarsat-2 C-band data for correlations with forest structure and species data in Amazon. Might be interesting to look into their methods for sites in Thailand.
- Jones et al, 2016:
- Used Giri’s data to assess changes in mangrove cover at national level for Madagascar. Produced higher accuracy maps with improved detail relative to Giri’s data. Potentially interesting for Thailand.
References
Adam, Elhadi, Onisimo Mutanga, and Denis Rugege. 2010. “Multispectral and Hyperspectral Remote Sensing for Identification and Mapping of Wetland Vegetation: A Review.” Wetlands Ecology and Management 18 (3): 281–96. doi:10.1007/s11273-009-9169-z.
Heumann, Benjamin W. 2011. “Satellite Remote Sensing of Mangrove Forests: Recent Advances and Future Opportunities.” Progress in Physical Geography 35 (1): 87–108. doi:10.1177/0309133310385371.
Kuenzer, Claudia, Andrea Bluemel, Steffen Gebhardt, Tuan Vo Quoc, and Stefan Dech. 2011. “Remote Sensing of Mangrove Ecosystems: A Review.” Remote Sensing 3 (5): 878–928. doi:10.3390/rs3050878.
Giri, Chandra. 2016. “Observation and Monitoring of Mangrove Forests Using Remote Sensing: Opportunities and Challenges.” Remote Sensing 8. doi:10.3390/rs8090783.